Flow - A Tool to Record and Visualize your Application Executions
- 5 minsHave you ever had to make complex changes to a code base you knew nothing about in a short time frame? If yes, then you probably know how much a pain it can be to understand the internal workings of a project that you have not contributed to. Especially if you are targetting a large project.
In this article, I’ll talk about Flow, a tool designed to help developers understand the structure and behavior of their Java applications. I will explain why, and how, we use it in our team at NIST.
Motivations
Part of my work among the Software Assurance Metrics And Tool Evaluation (SAMATE) team at NIST, is to design test suites that are used to evaluate the performance of source code analyzers. Source code analyzers are tools that can parse your source code and/or execute it to find security flaws and report them.
To design such test suites we are interested in manually injecting security issues into production software. This means essentially that we examine a project’s code base and look either for existing flaws or specific locations where we could actually inject insecure behavior.
Keeping execution traces of how our source code modifications impact the behavior of the application is decisive for us.
However, this is a challenging task. Reading through the source code is painful and sometimes it is really hard to figure out the connections between two pieces of source code. Print statements have their limitations, and while debuggers can help, they also have their limitations in this scenario.
Hopefully, this is something that a Java profiler like Flow can help us with.
Why Flow?
There are already plenty of robust Java profilers of different flavors out there. Some allow you to monitor the entire JVM (VisualVM, JProfiler, …), while others, called Java Agents, make use of the Java Instrumentation API to inject code at the bytecode level of your application (New Relic, XRebel, Prefix, …).
So why yet another JVM Profiler?
Flow is a recent product in active development that has not yet been tested thoroughly like other products. And yet, this tool caught our attention for many reasons.
Flow provides a really intuitive and user-friendly visualization of execution traces. We’ll get into more details later in this article, but for now, see for yourself:
Flow is also easy to set up and use. It took us only a few minutes to get it going and running.
And last but not the least, let’s be honest here, Flow might not be open-source, it is however a free product. Looking at the market pricing of such tools, it is unfortunately something worth consideration (some similar tools can cost hundreds of dollars a year).
Let’s now dive into Flow features!
Flow Features
Flow allows you to record executions and let you visualize what happened at runtime through a web interface.
Recording
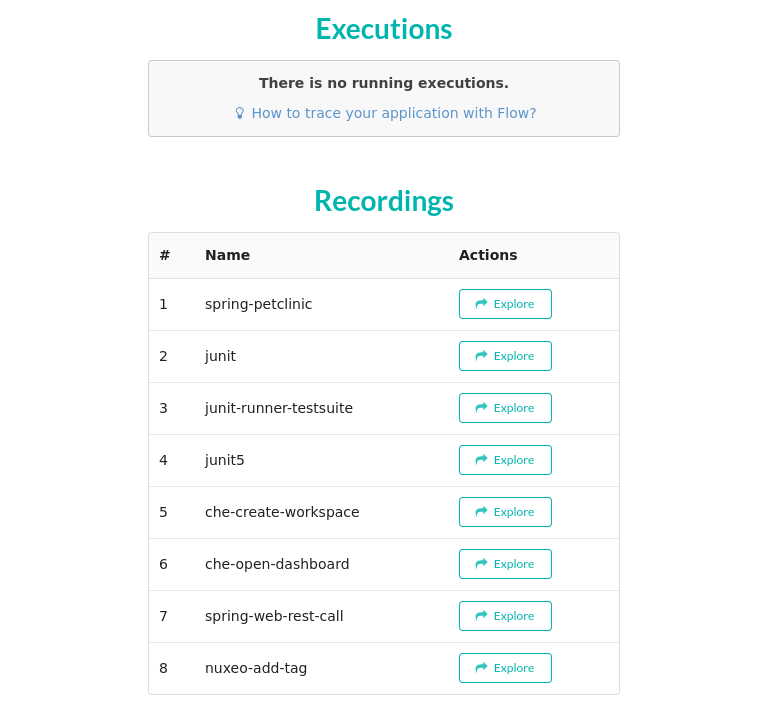
It is possible to manually start and stop the recording of an execution.
Since Flow can handle up to 50,000 calls for each recording, this is extremely useful. In the case of a web application, you can use this feature to pin point and record a specific user action and see what happened at the runtime.
Every execution is saved which allows you to load previous recordings and explore them again:
Visualization
You can explore any recording and visualize it through the same web UI. The output is divided into 3 parts:
- the call graph,
- the call stack,
- and a timeline.
The call graph is a dynamic graph representation of the recorded execution. You can navigate through 3 different levels of abstraction: at the package level, the class level, and the method level.
The call stack view provides information on the different method calls in the execution and their relationship. It is displayed along a timeline which shows a line for each thread running during execution.
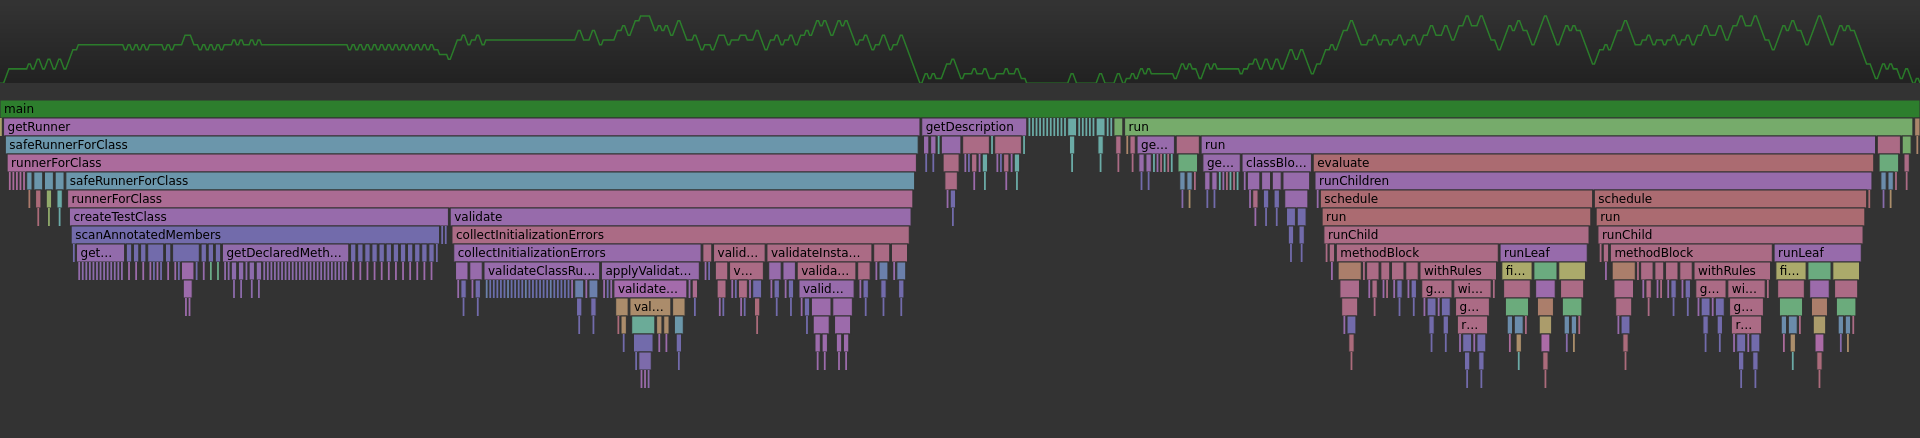
One of the nicest feature of Flow is being able to zoom on a specific time window. This allows you to clutter out the view when you are interested in a specific method and focus on what’s really important.
When there is a lot of data, you can also interact with the visualization by filtering and searching elements, like method names, or maybe packages or classes. This helps a lot when dealing with a lot of data.
Conclusion
Flow is a really nice tool that helps you visualize how your Java applications work. When it comes to understanding legacy code, or just maybe an open-source Java project you would like to contribute to, Flow can be a real life-savior and save you a lot of time by displaying in an intuitive way runtime executions of your target program.
Some features are still missing, like the ability to easily share the recordings and export them, or retrieving the runtime values of method parameters, but overall, Flow is IMHO a great addition to the spectrum of Java profilers.
I was really glad when my colleague found this tool, because it gave us just the right amount of information relevant to us. However, with such a cool name, it was hard to find Flow. Therefore, I hope this article will help people find this tool!
If you want to learn more about it, I highly recommend you to check out their official website (from which are taken the nice animations ![]() ).
).

Damien Cupif
I help companies build more secure and reliable software